Teri Campbell

Product Manager | Clinical PT turned product builder | Now building AI products that help people take the next step
LinkedIn Profile
Analysis of Age and Speed in Olympic Swimming: 1896-2022
INTRODUCTION
Project description: Growing up as a competitive swimmer, the Summer Olympic Games were always a highlight of the season. The swimming athletes continued to get faster year after year, and at times it appeared that the athletes got younger. Until some star swimmers were highlighted who were in their 30’s and even 40’s. Then came the year that is notorious in the swimming community for the introduction of swim suits with buoyant properties. The suits were worn by swimmers in the 2008 games, but banned for use in the Olympic Games by 2010 due to performance enhancing properties.
I wanted to examine historical Olympic Swimming data to explore both age and speed of the athletes over the years. In particular, I wanted to highlight the impact that the buoyant suit era had on olympic swimming results, including whether there was a lasting effect and if the times achieved would ever be beaten.
This project was focused on gaining insights related to elite level swimming at the Olympic Games.
Hypotheses
-
I expected to see progressively faster results in each event each year
-
I expected to see that athletes ages, on average, increased slightly over the years
-
I expected that the impact of the buoyant suit era might still be present, with the fastest times in some events still not yet meeting the fastest times from 2008.
-
I expected any impact on time from the buoyant suit era would be represented equally across all events and seen in both men’s and women’s events.
Limitation: this study looks exclusively at Olympic Games results and does not represent results and records outside of the Olympic Games such as other elite national-level events or world records.
DATA
The dataset was downloaded from Kaggle and contains results for Summer and Winter Olympic Games for the years 1896-2022. It contains 4 tables, 3 of which were useful for the purposes of this project It is noted that while the name of the data set is “Olympic Summer & Winter Games, 1986-2022”, the description clarifies that the data actually includes “Medals & Results & Athletes from Athens 1896 to Beijing 2022”. Swimming records data for the 2022 Summer Games is limited to the top 8 finishers.
Olympic Swimming pool length is 50 meters long. While some events have evolved over the years, this analysis focused solely on events that were consistent. Certain events have not been a part of the swimming line up for as long as others, resulting in reduced overall results sections for these events.
The dataset can be found here: https://www.kaggle.com/datasets/piterfm/olympic-games-medals-19862018
Data was cleaned, filtered, and analyzed using Excel, BigQuery Sandbox, and Tableau Public
ANALYSIS
To start, I used SQL for cleaning and exploration and decided to focus on a single event, the Men’s 100m Freestyle.
First I wanted to see an overview of the entire field of the Men’s 100m Freestyle over all of the years recorded in this dataset.
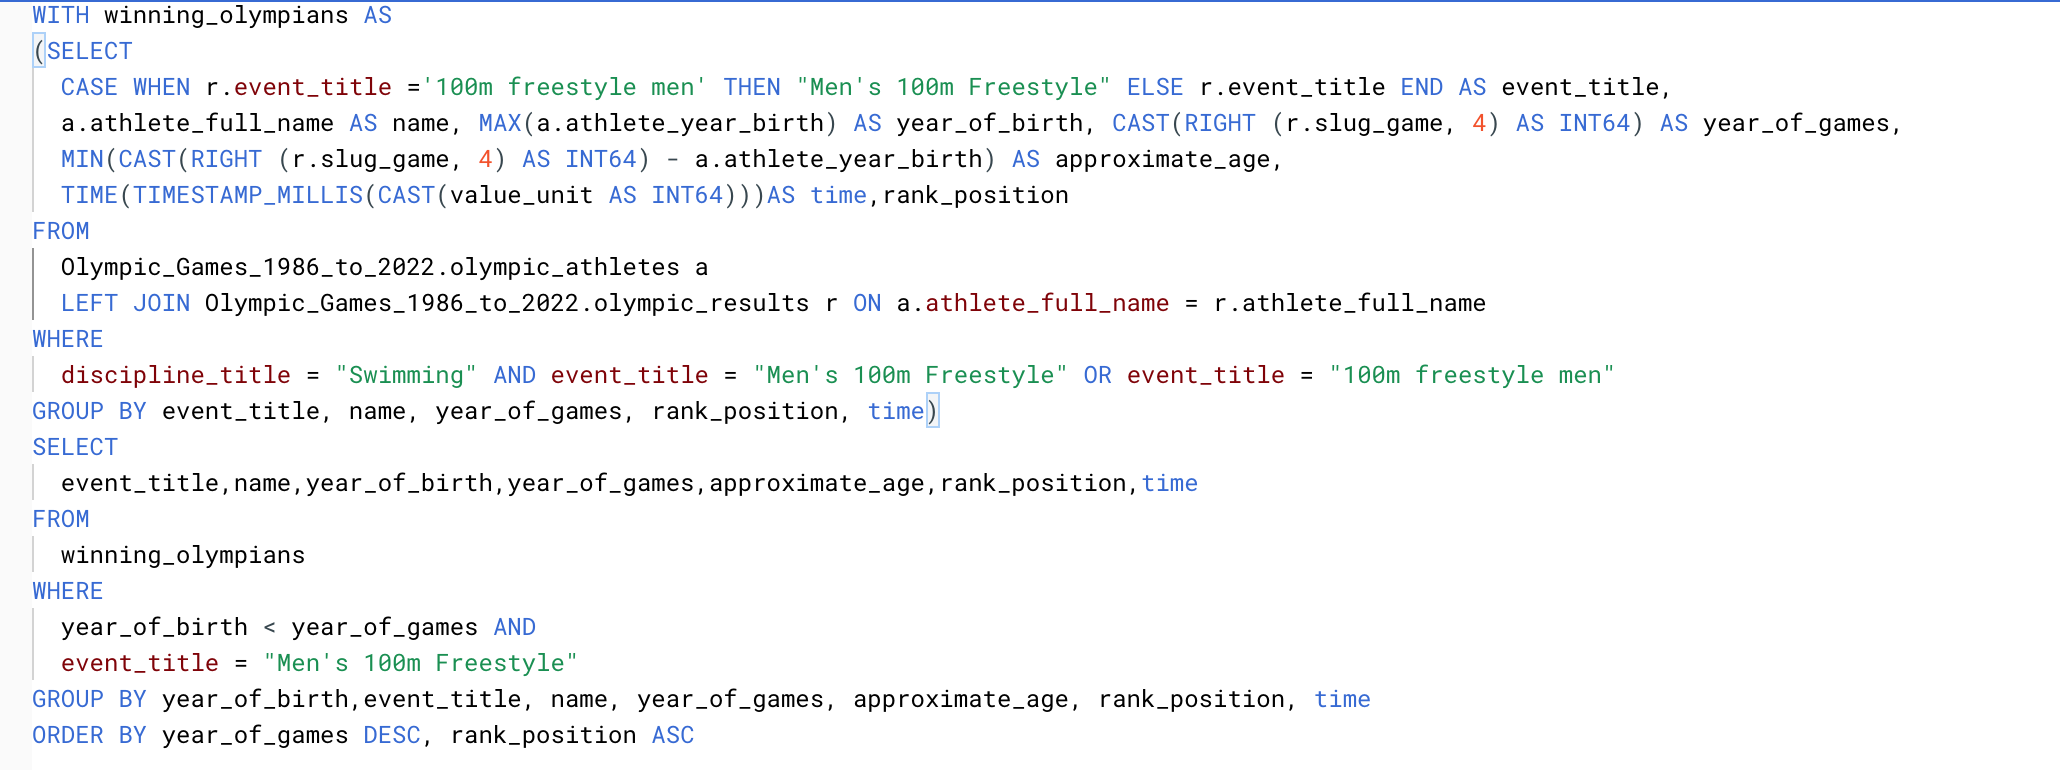
Interestingly, I was only getting results in 2020 for the top 8 finishers.
To see what was going on, I took a quick peek and learned that the data set only contained the times for top 8 finishers, and for 2020 only contained records for the top 8 swimmers.
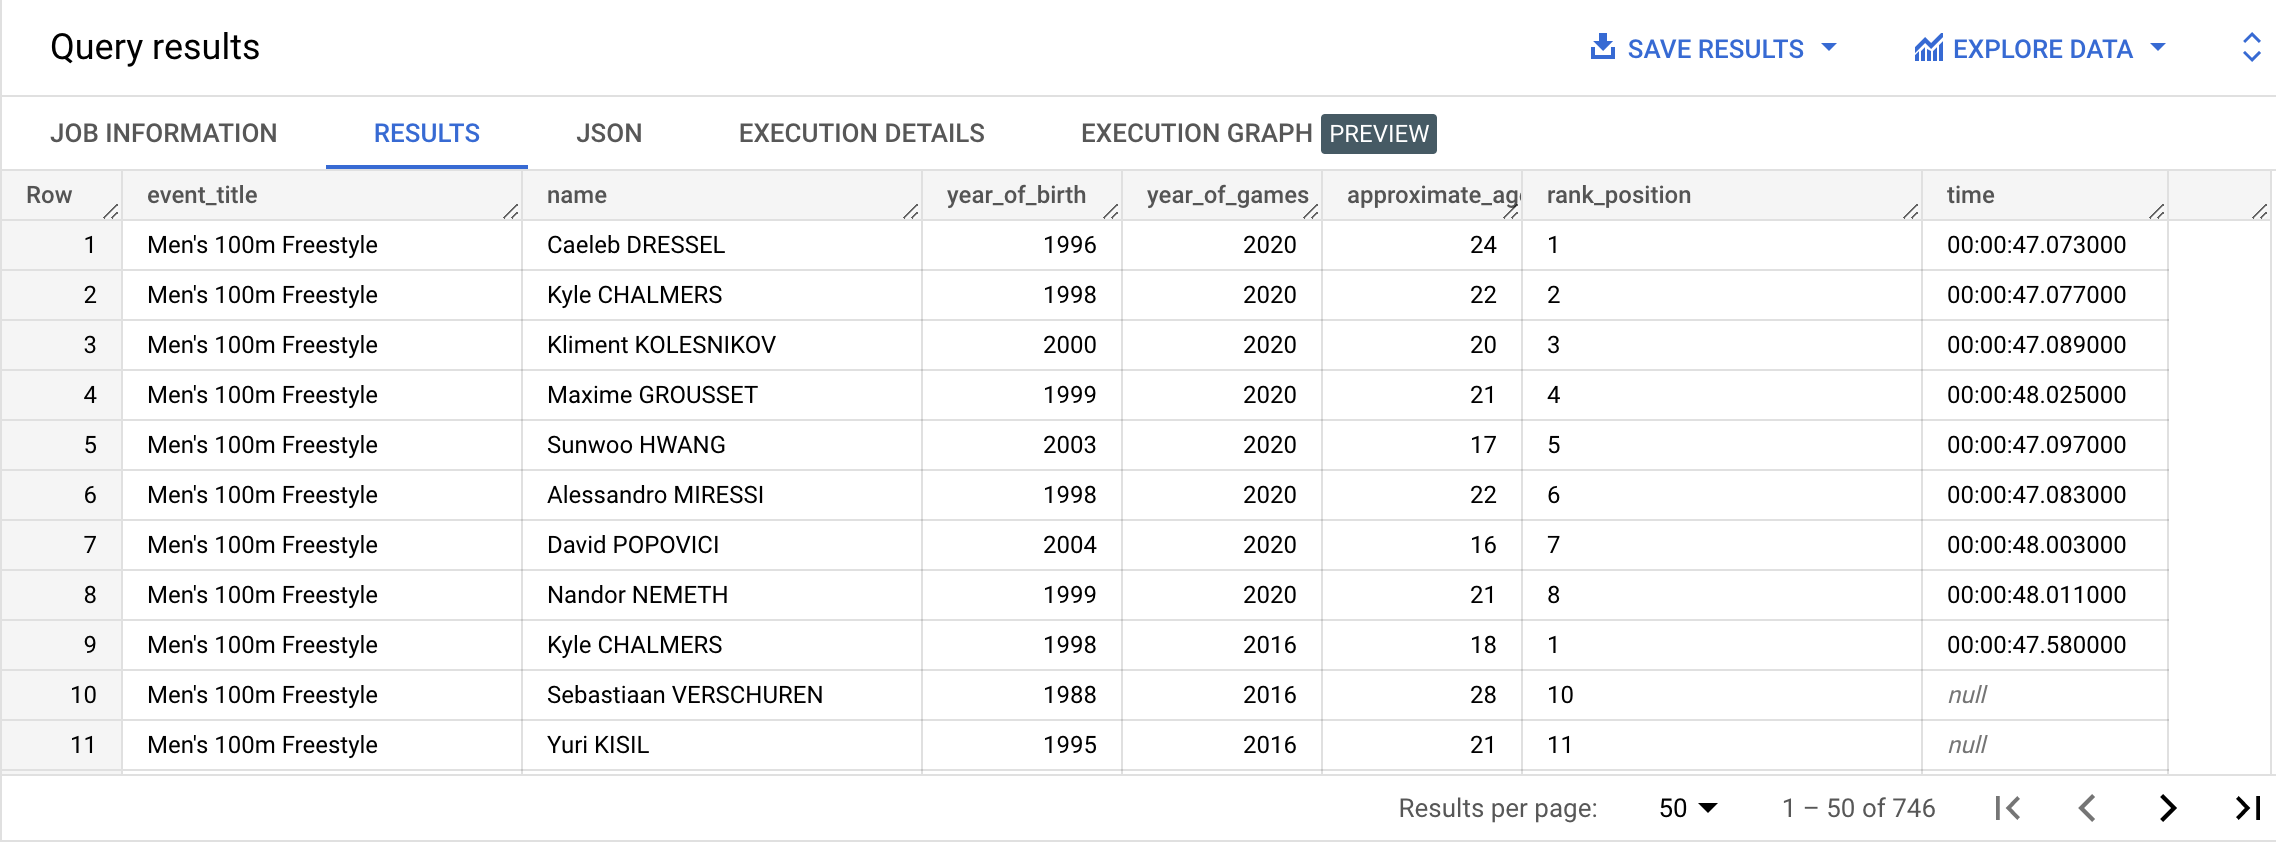
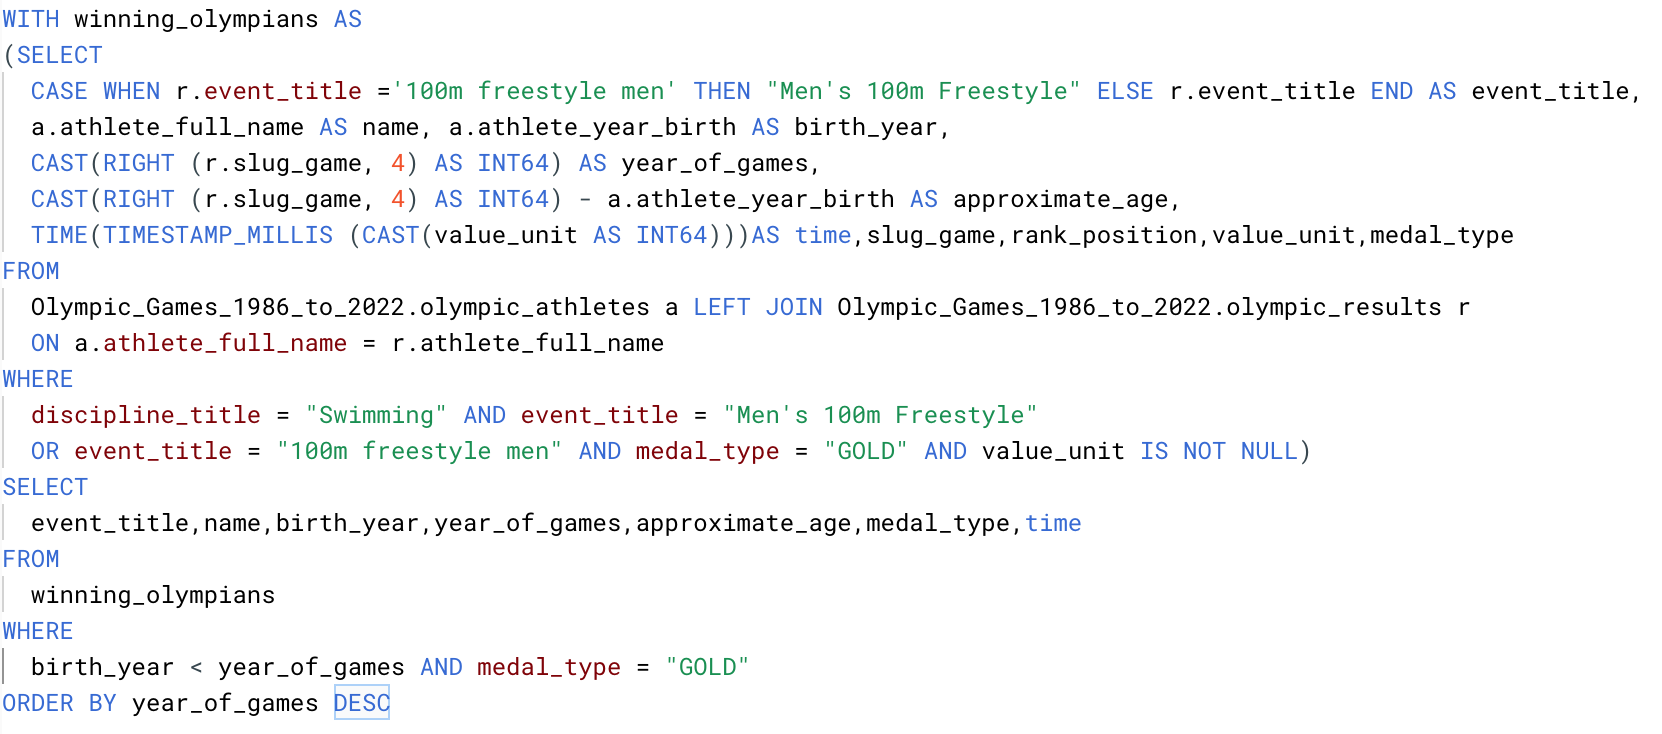
Zooming in and staying focused on the Men’s 100 Freestyle, I now wanted to know who the medalists were. I am curious who they are, how old they are, and how fast they are going. Here are the top 3 finishers across the span of years.
These results do show a drop in times for this event in 2008 that was not matched until the most recent games in 2020.
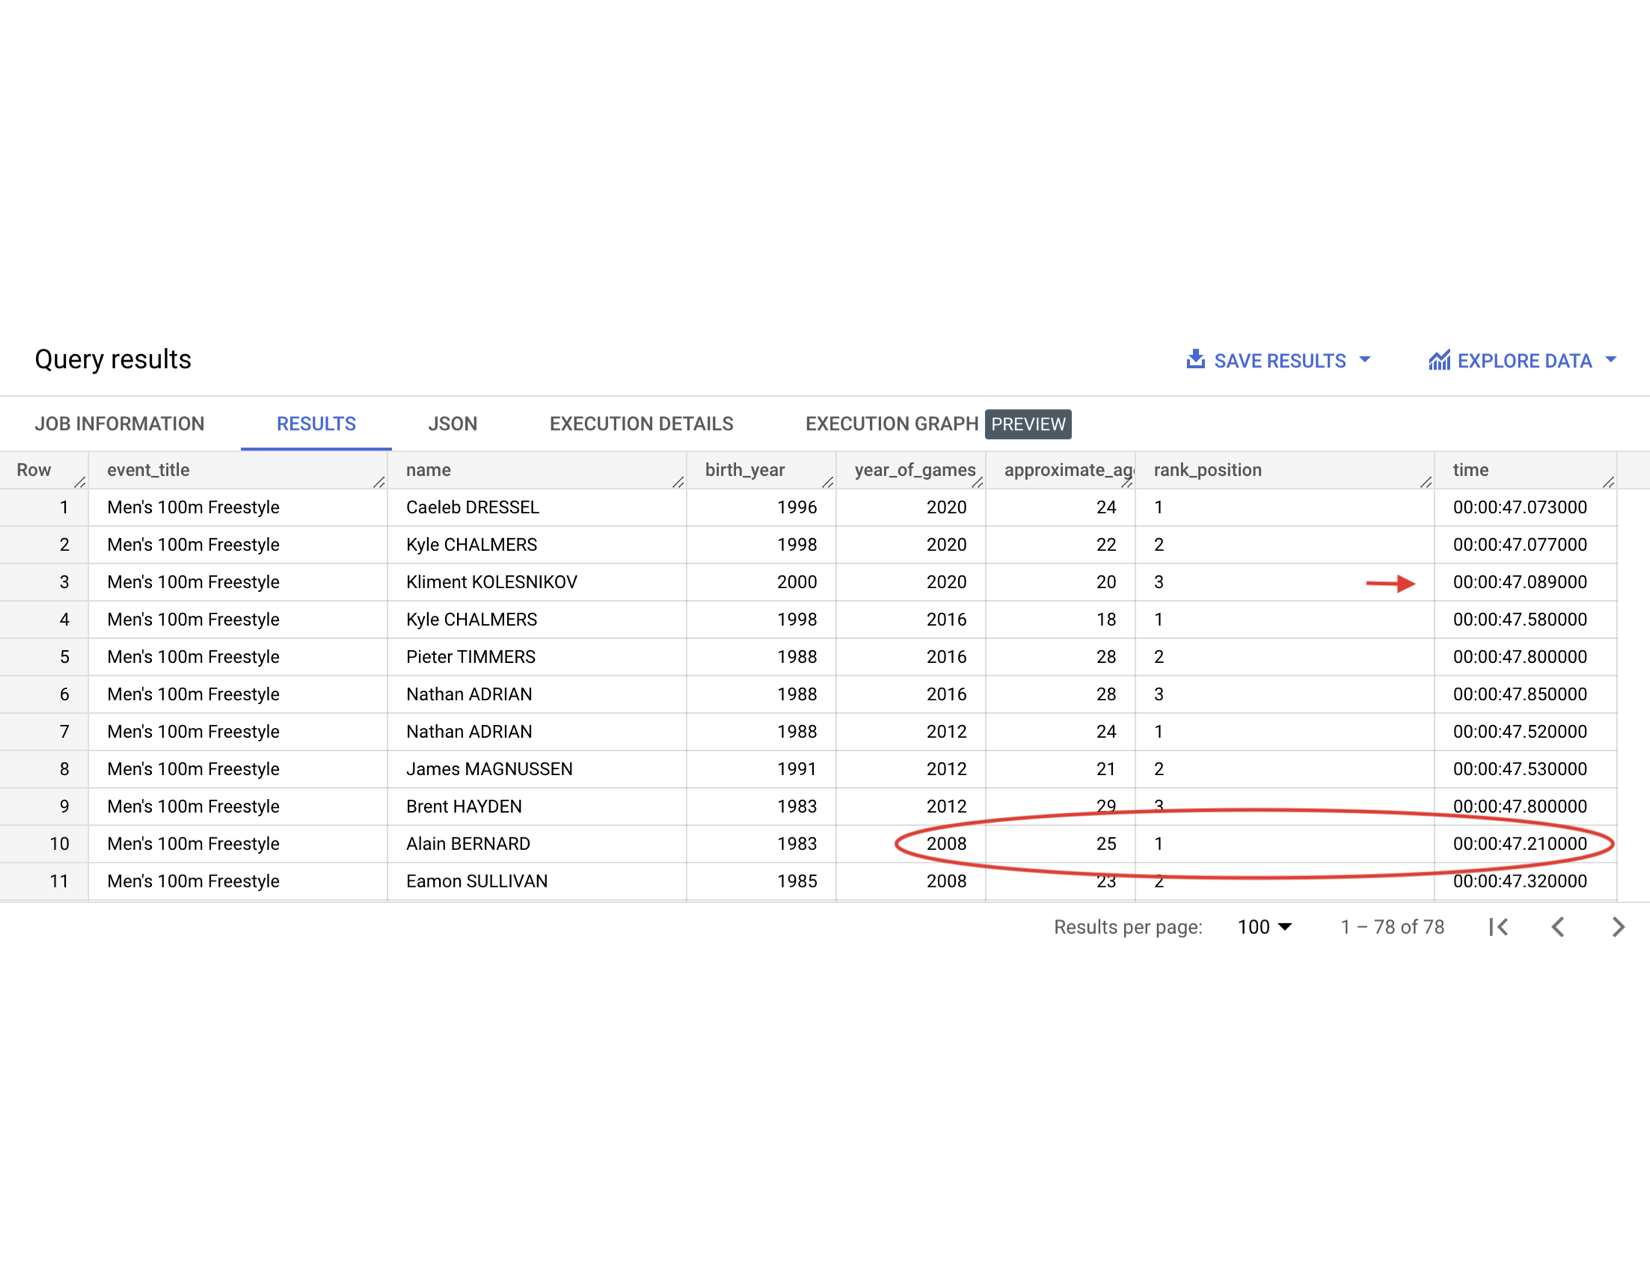
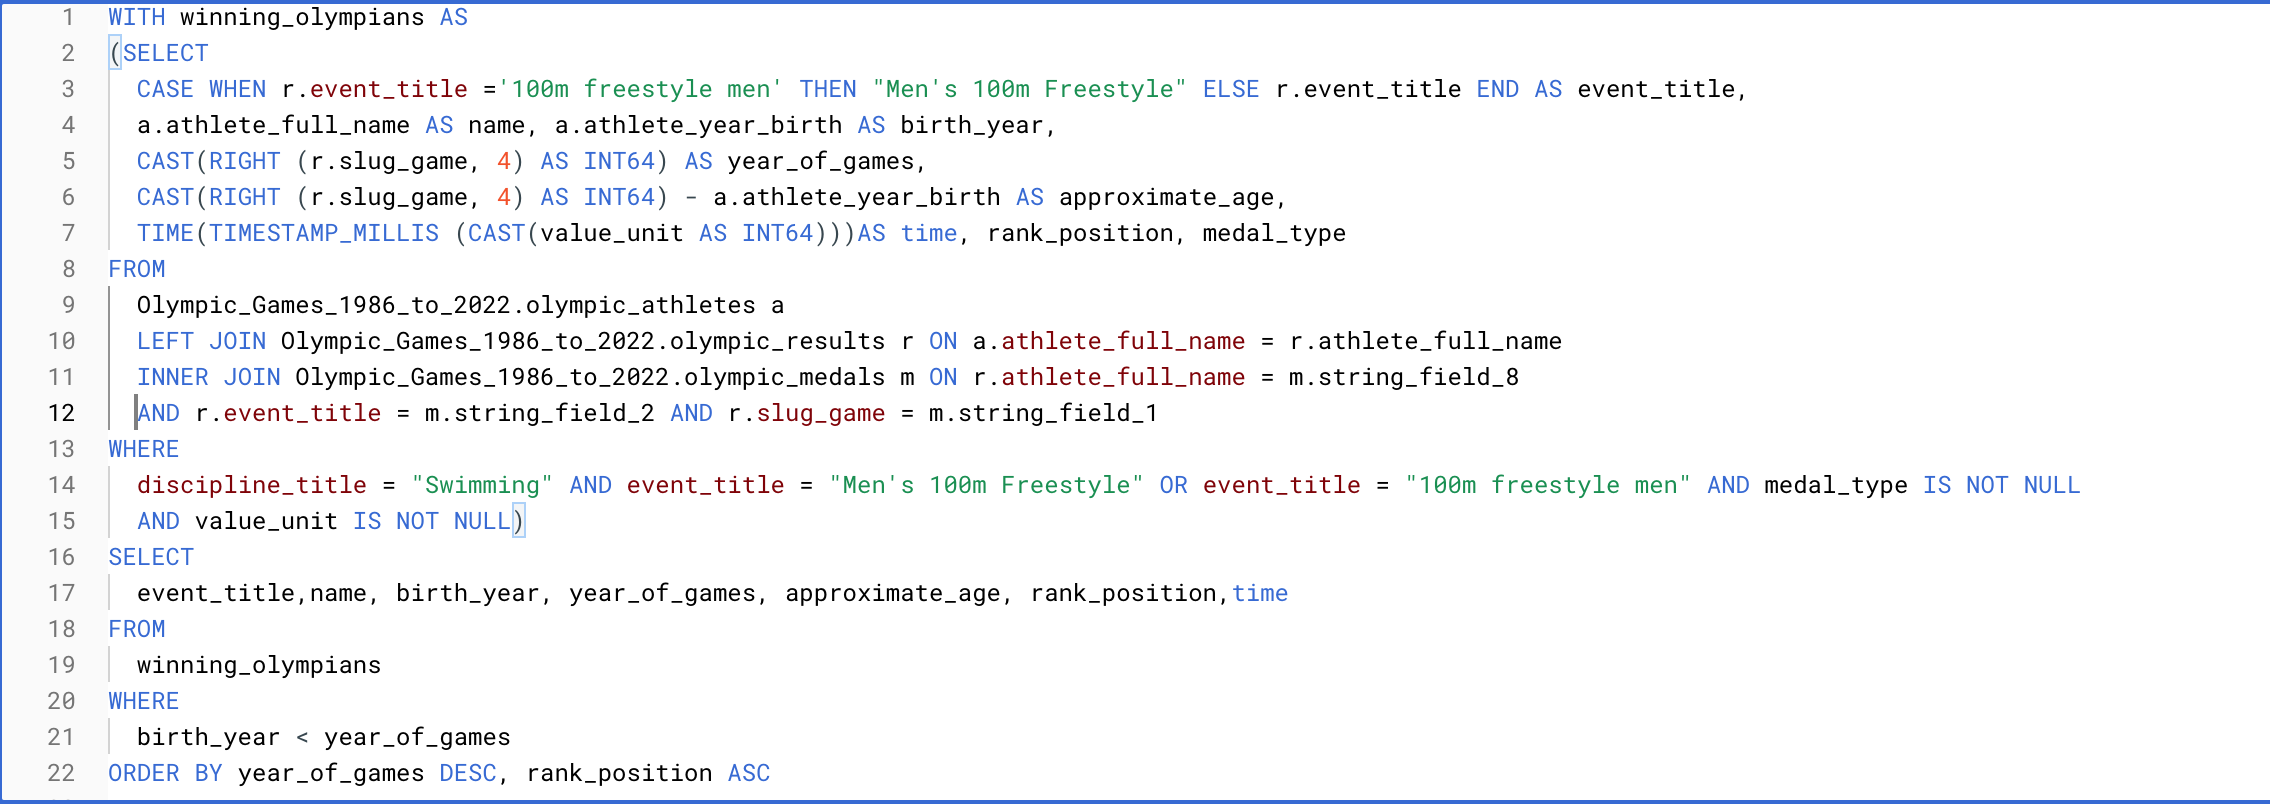
Of course, it would be hard to say that I wasn’t interested in the overall winner in the event each year.
The top time in 2008 was not achieved and beaten until the 2020 Olympic Games.
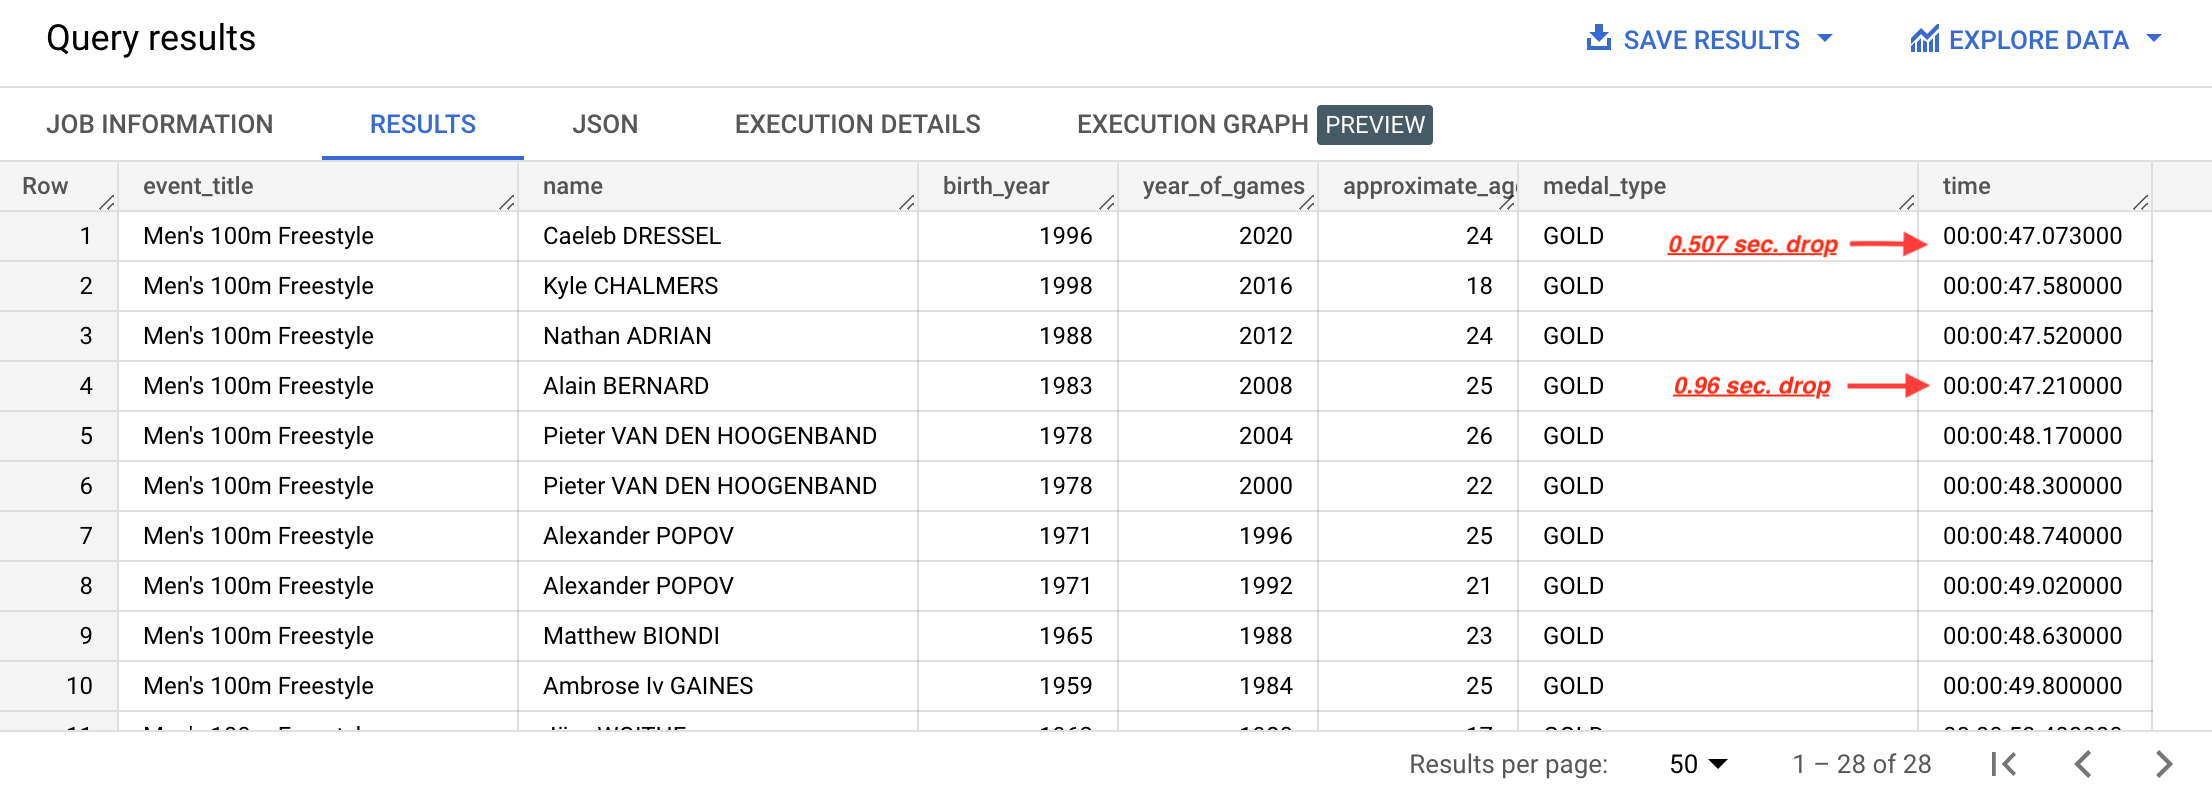
The relatively dramatic drop in winning time from 2004 to 2008 of 0.96 seconds is offset by a still impressive, but more modest, half second drop as the winning Olympic time from 2008 is finally beaten.
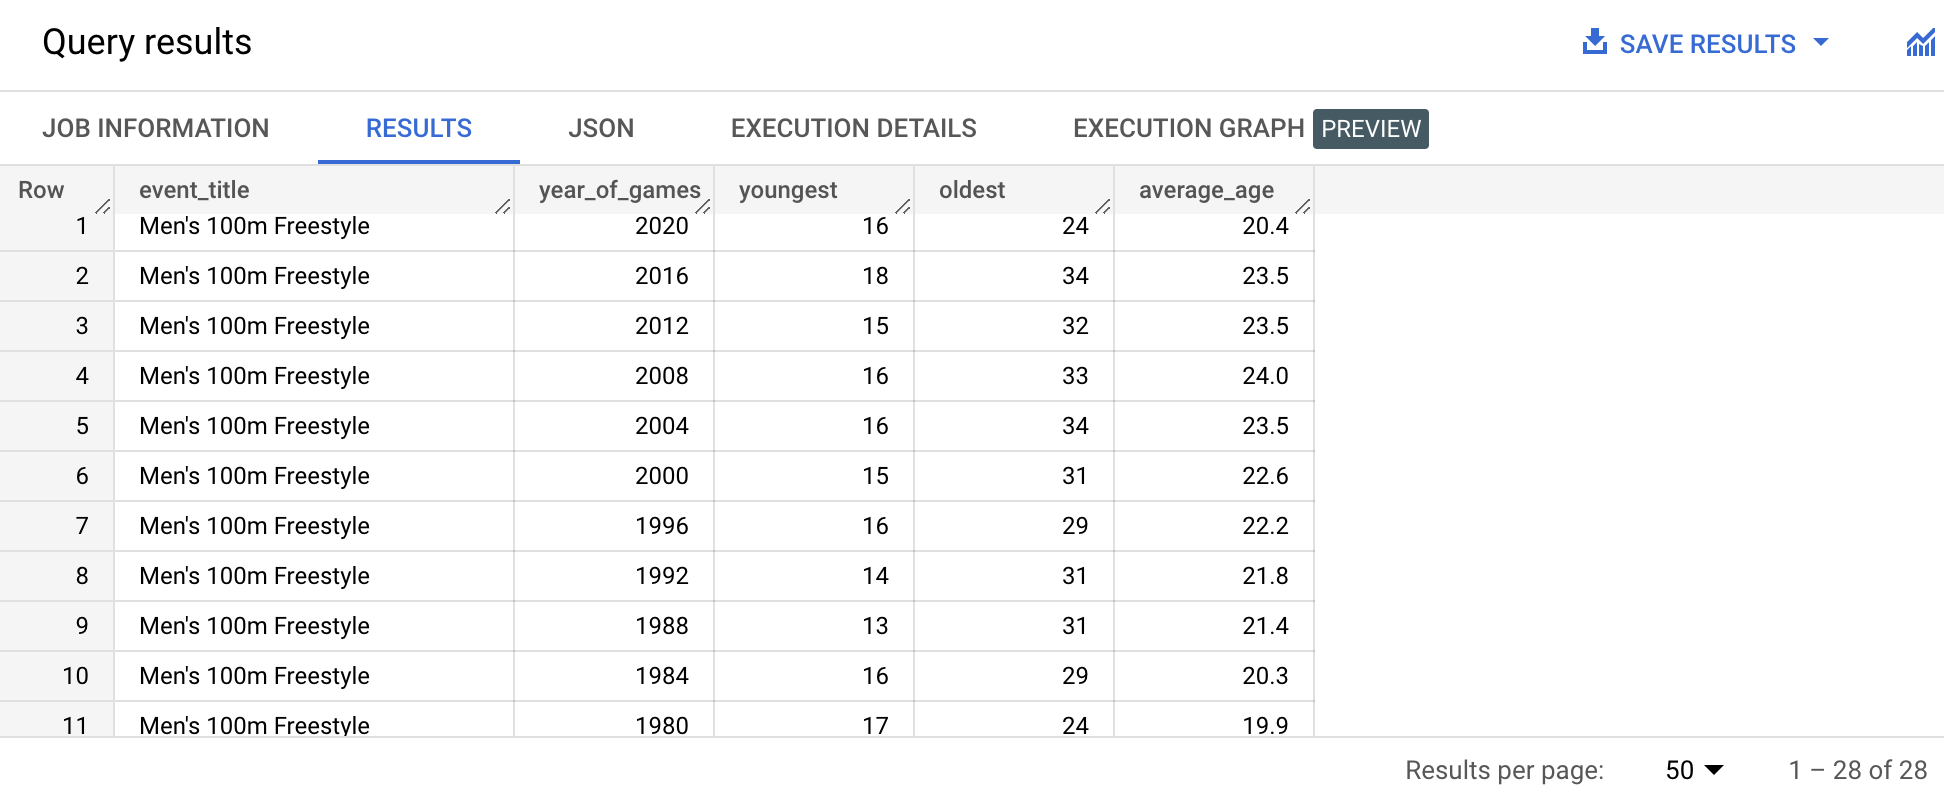
Next I took a look at some age statistics.
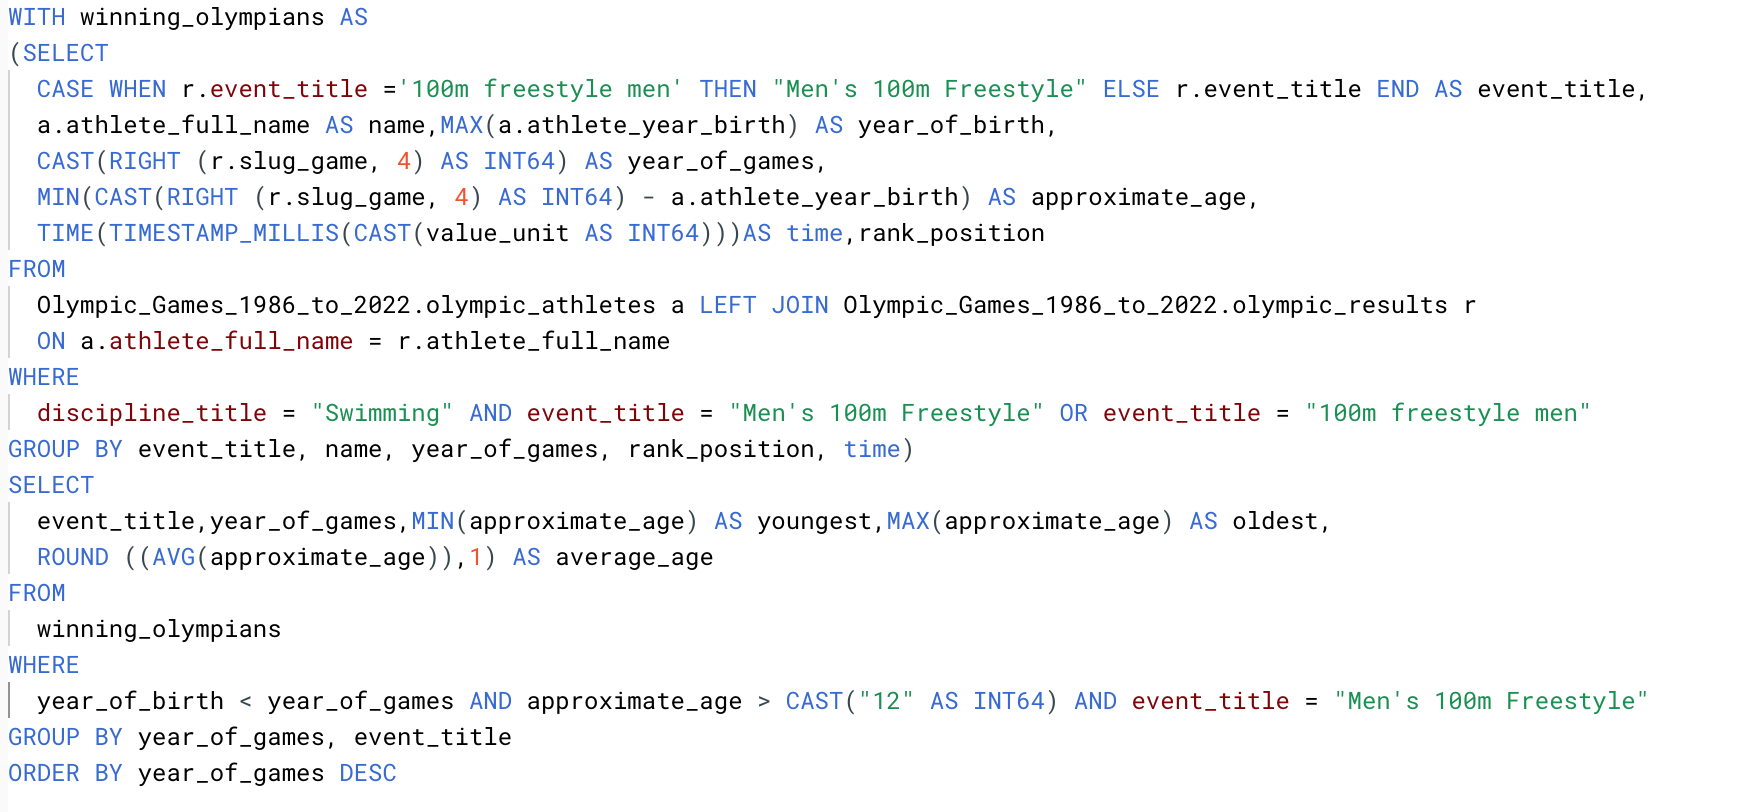
On initial exploration, one participant, Min-Seok KIM, was initially reported as 7 years of age, when in fact he was 17 for the 2000 olympics; However, Emile HAHOUD of Lebanon was indeed 13 years of age for the 1988 Summer Olympic games. We also see a general trend of average age in this event in the low 20’s across the entire field, with a dip just below 20 in 1980.
At this point I wanted to better visualize how all of these years of data relate. I now knew some of my dirty data from my SQL exploration, so I started by cleaning up my CSV file in Excel and uploading the cleaned data set into Tableau Public. I also intended to focus specifically on the Swim Data, so in my new file I included only swim data.
This makes it much easier for me to see the relativity in my data set. We can compare the average age of all of the swimming athletes each year and see a similar trend with a general dip in the average age of the swimmers from 1968-1980.
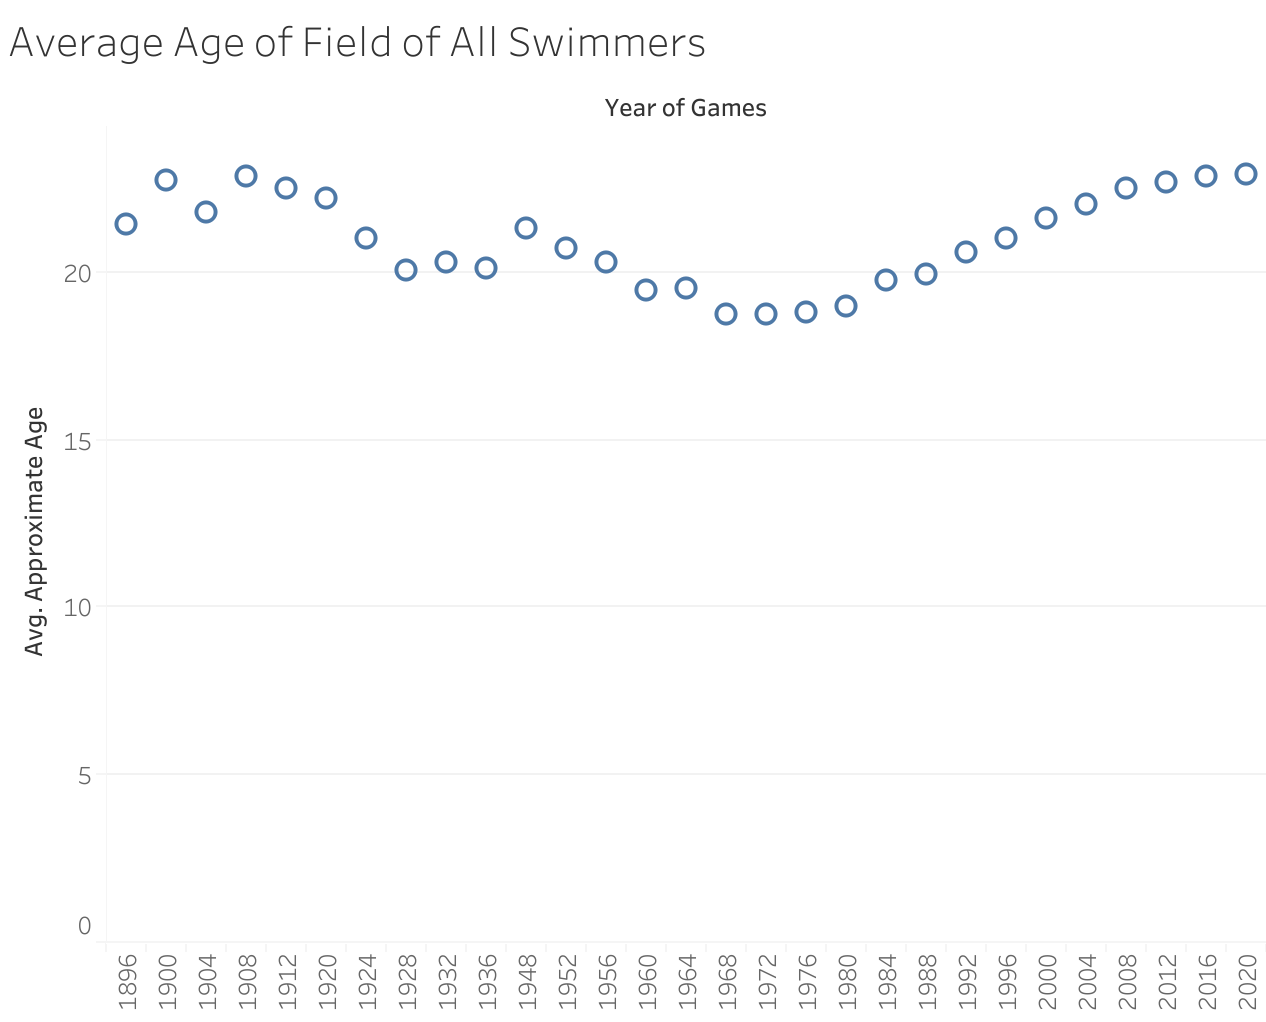
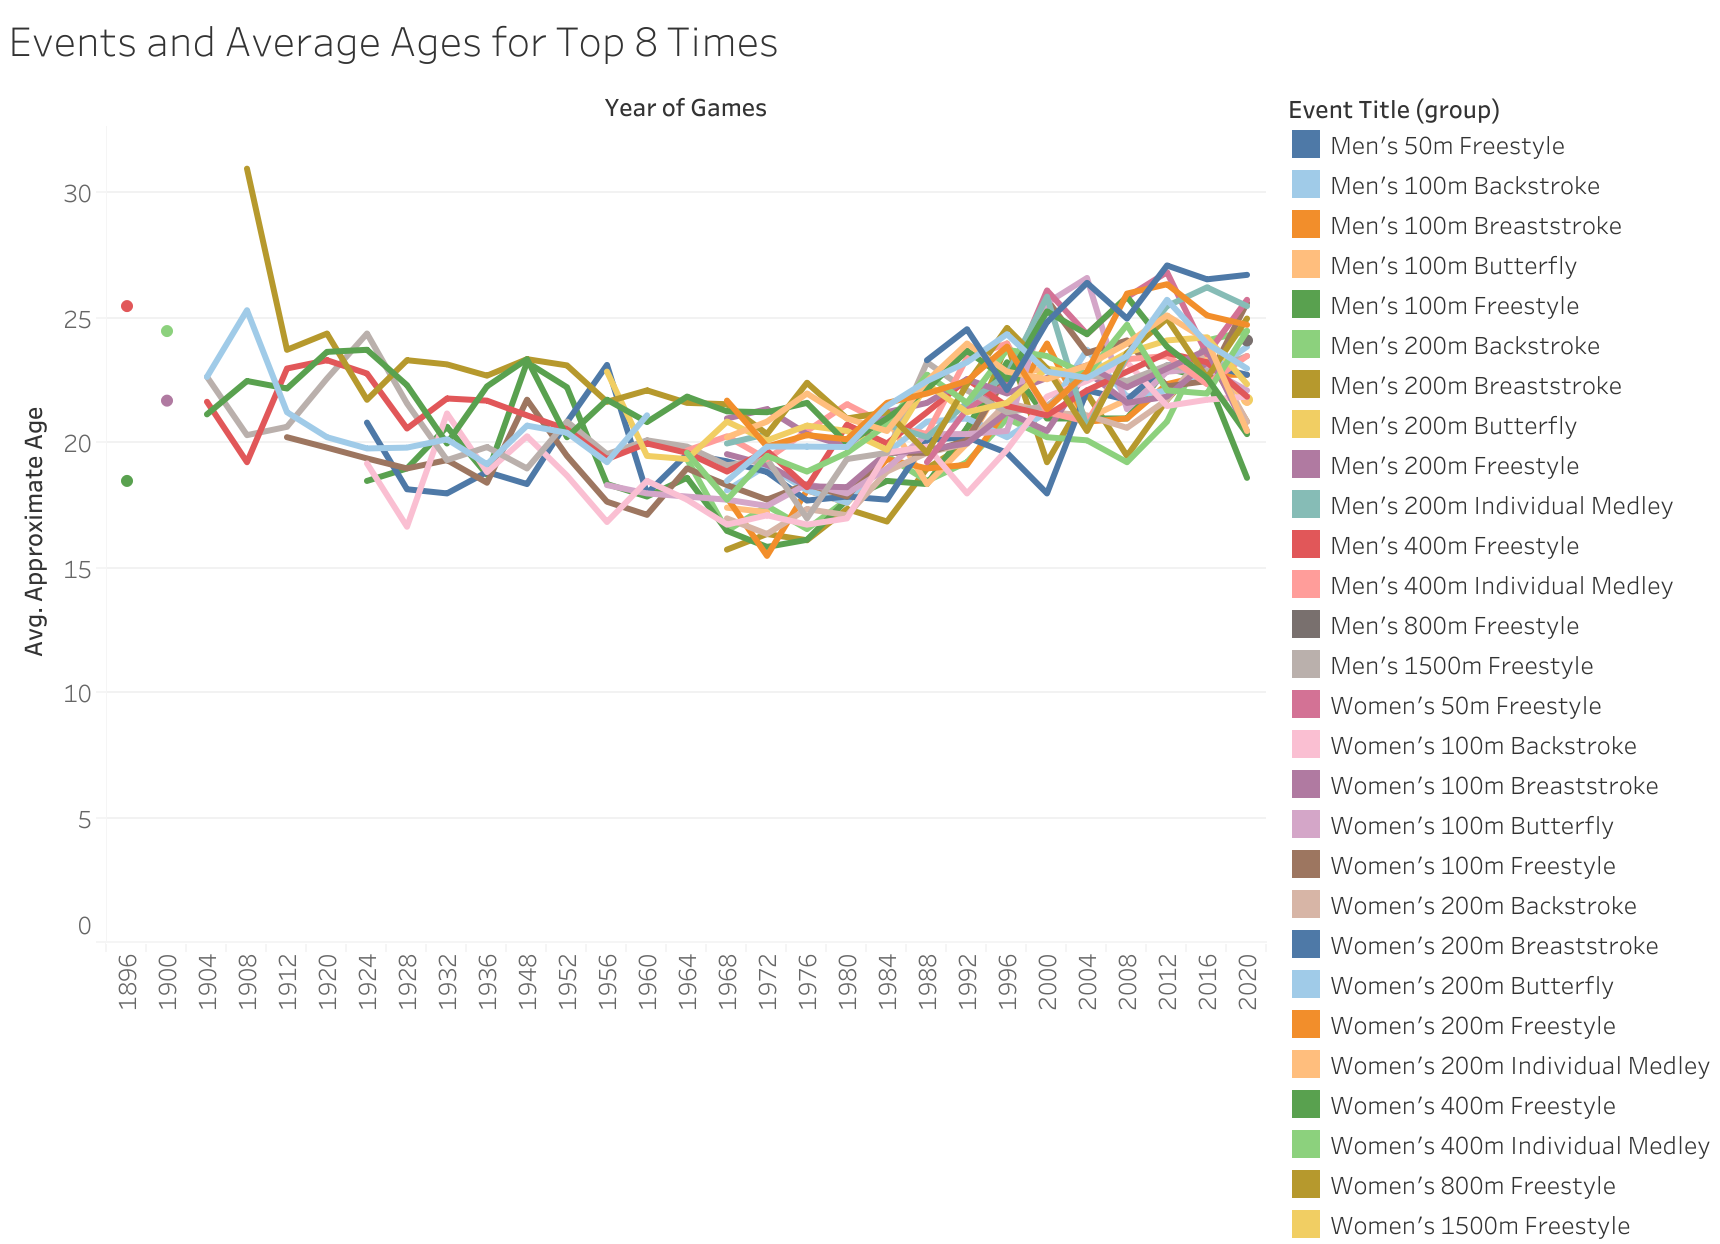
A look at average age trends in all events also shows a similar pattern.
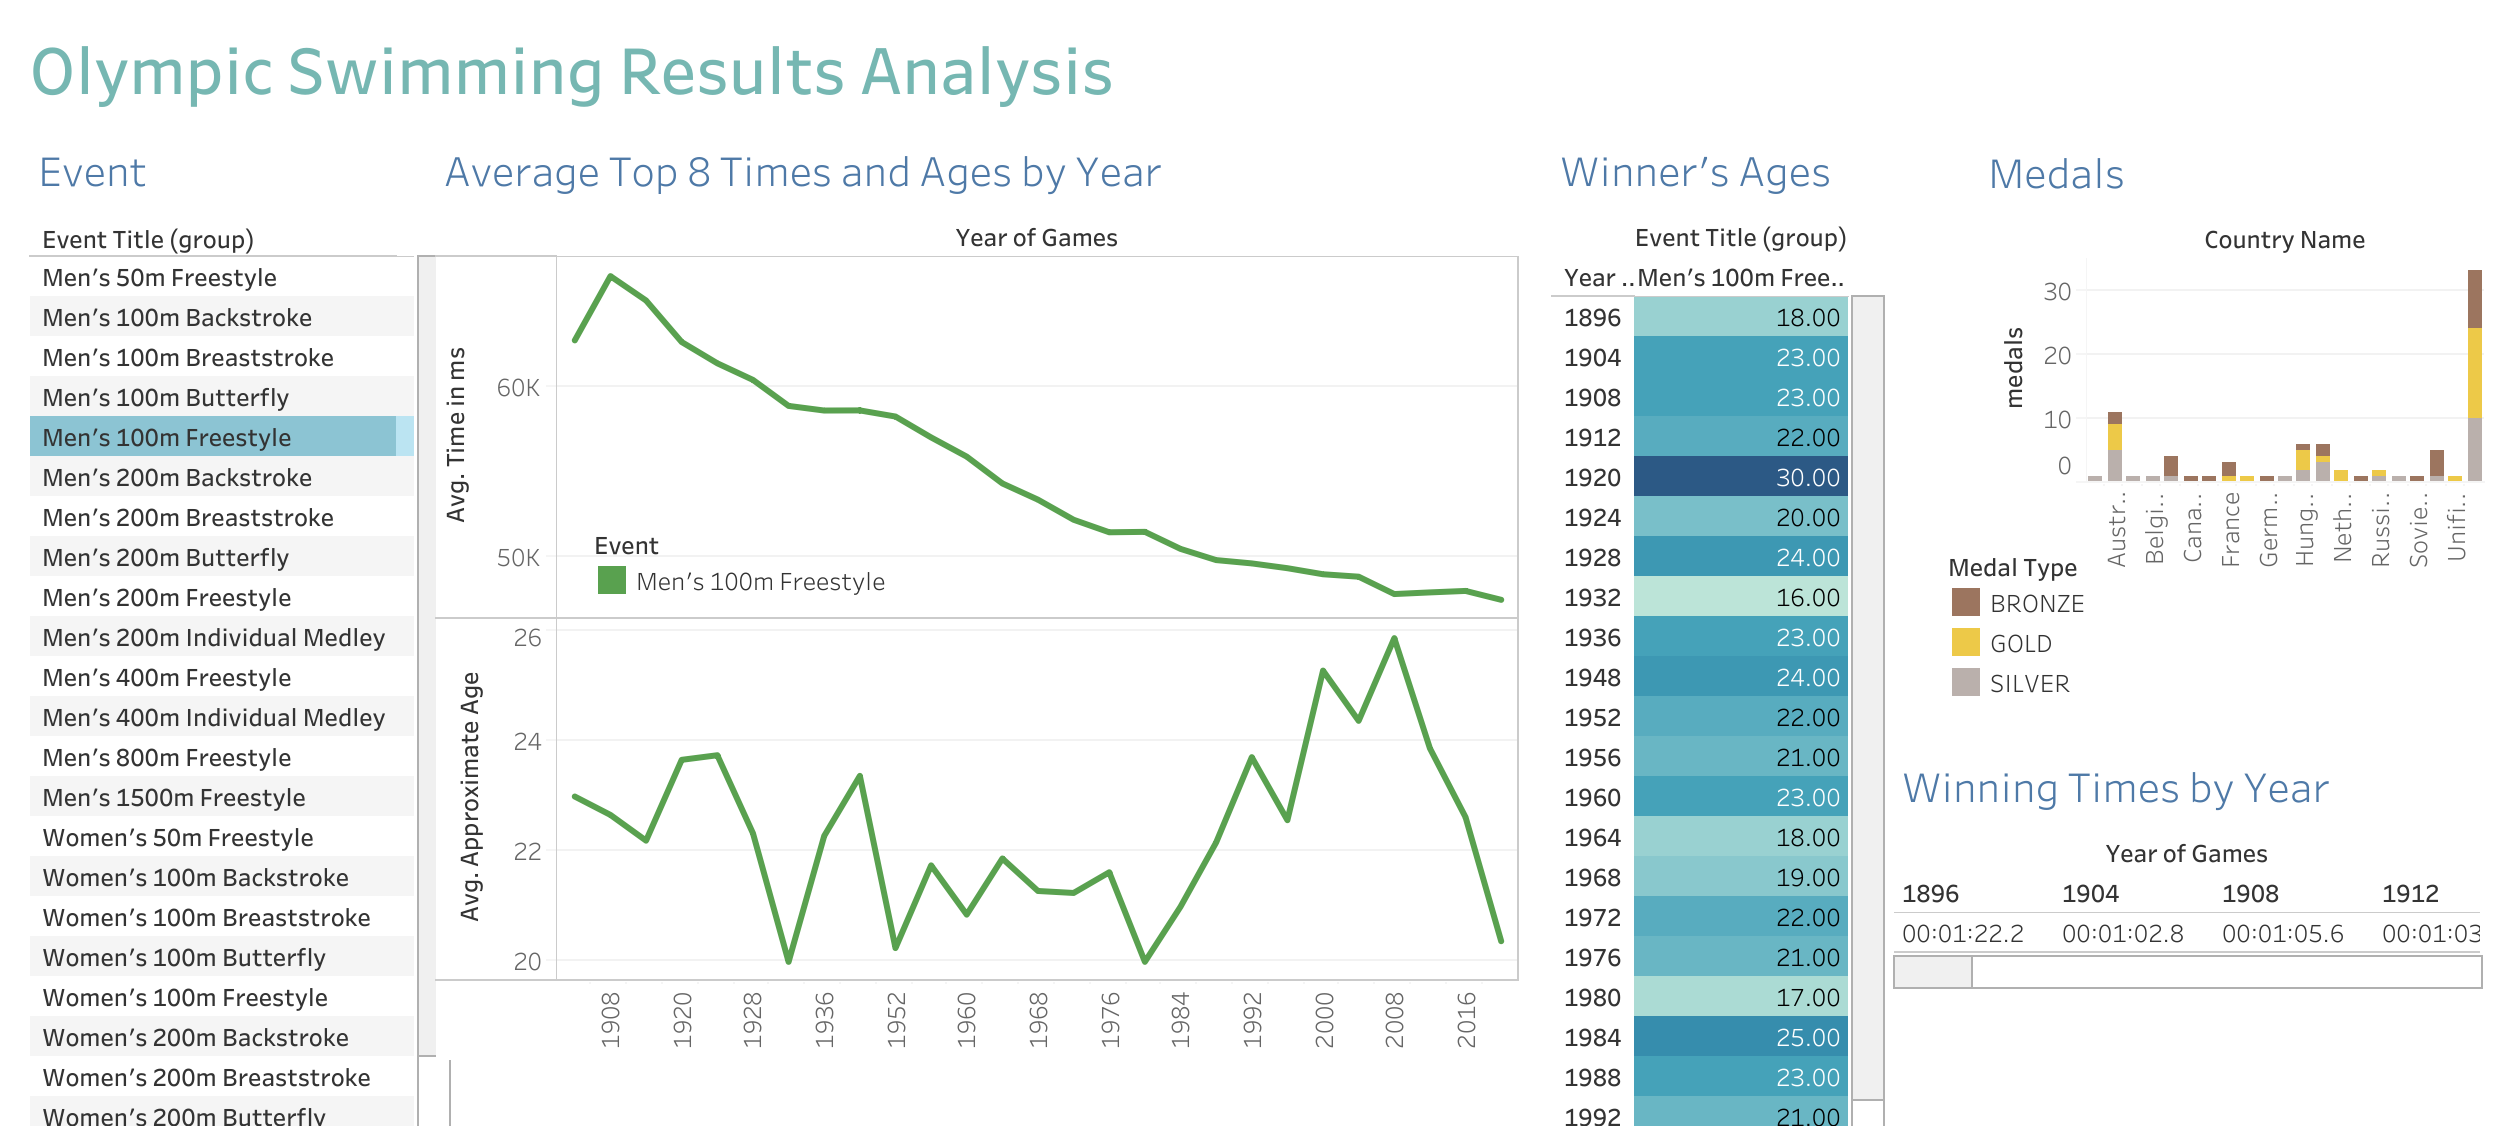
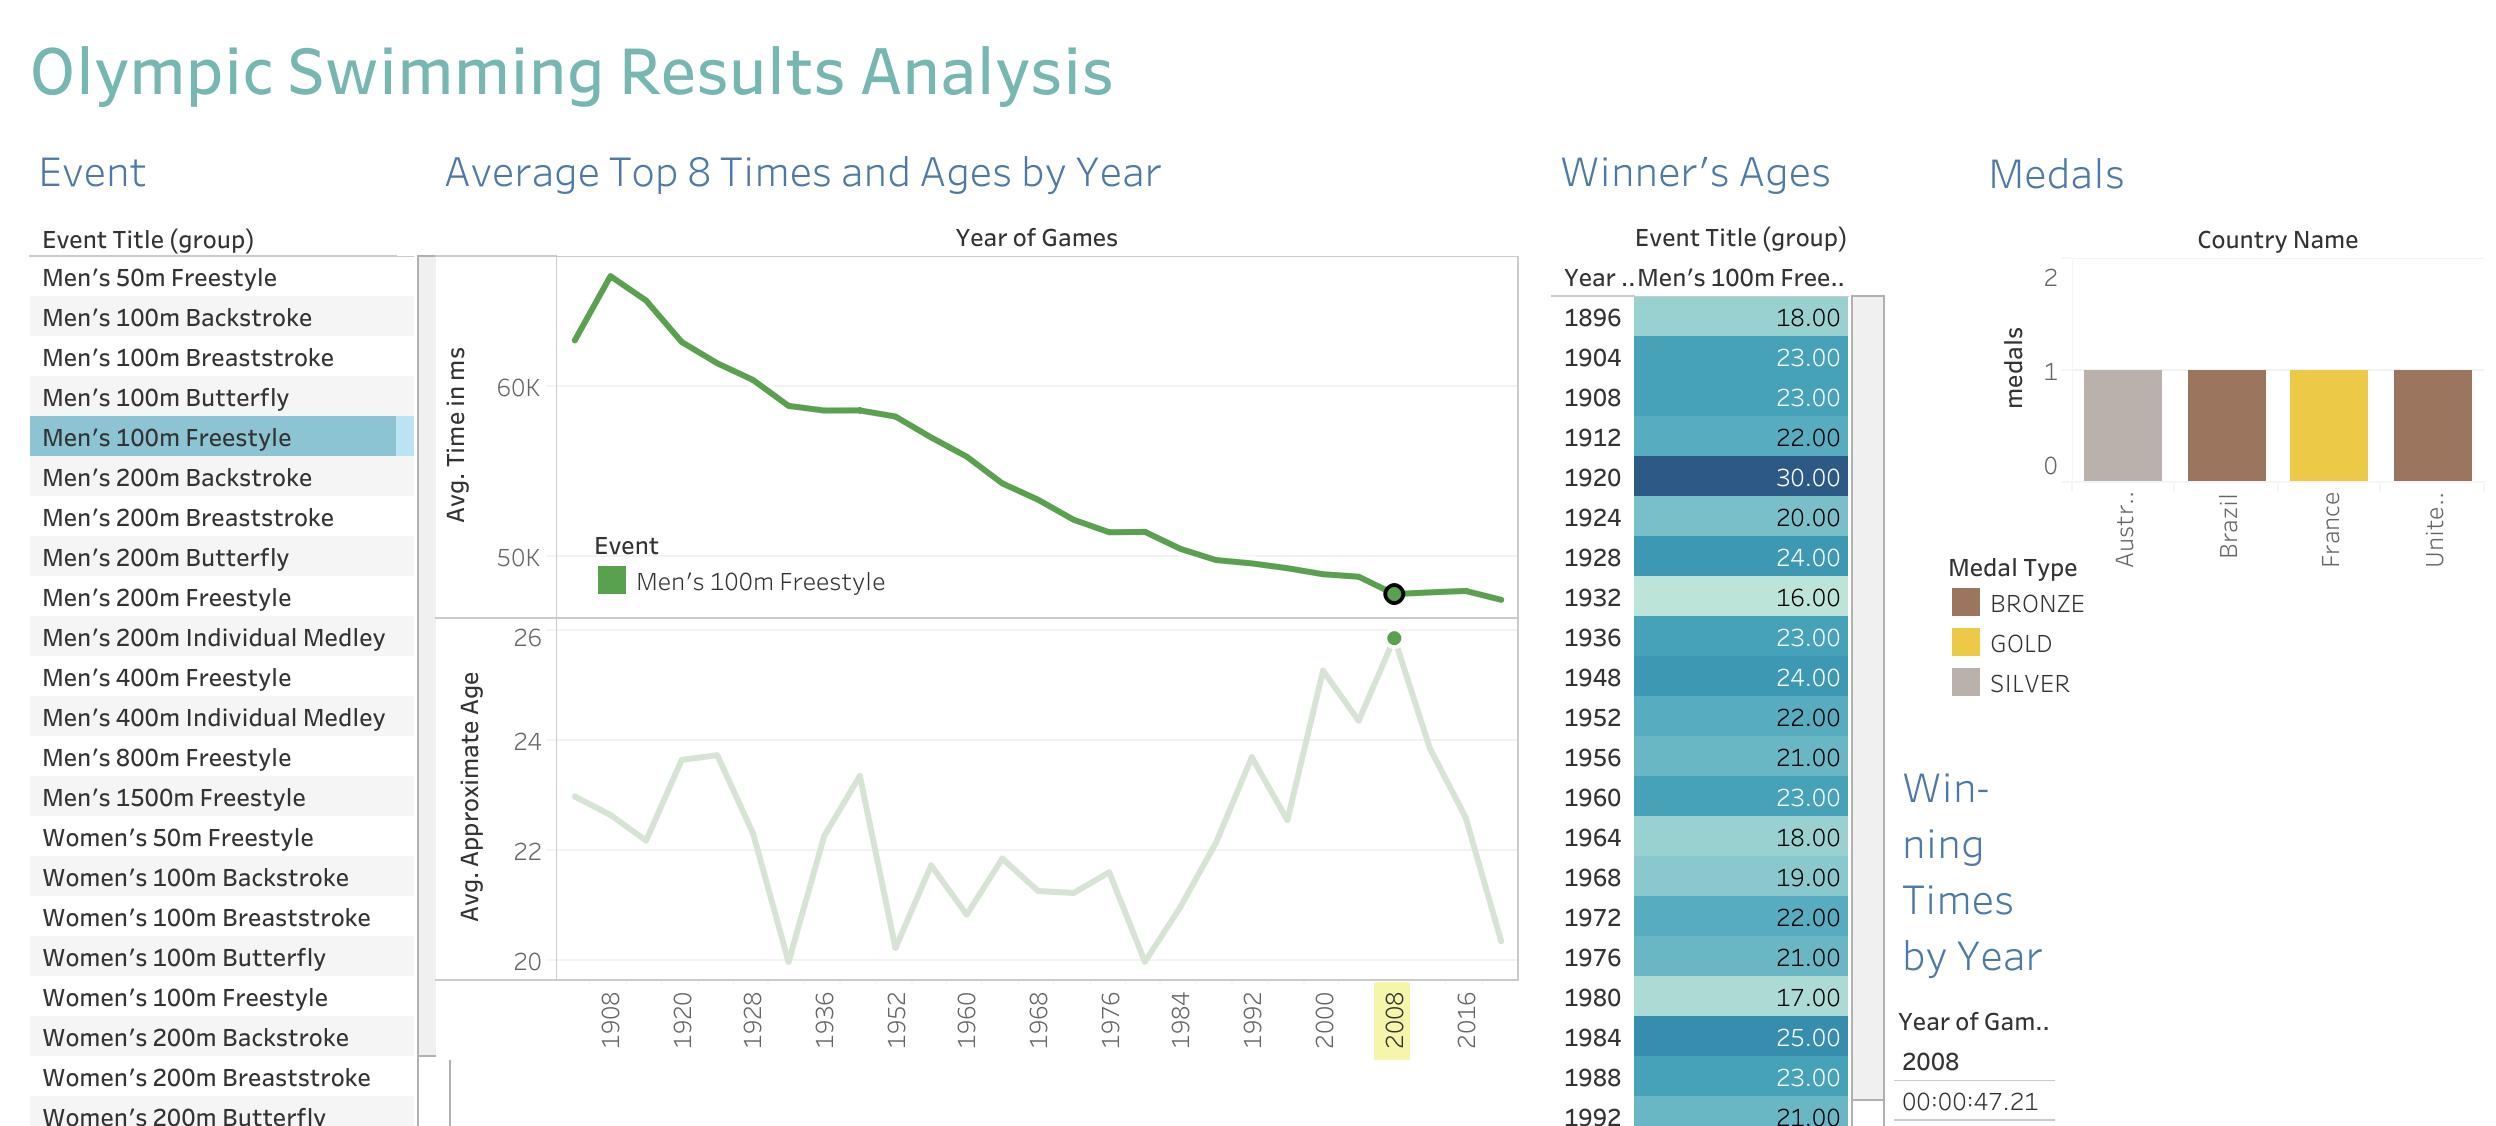
In order to better show changes over time for each swimming event in the Olympics, I next created an interactive dashboard in Tableau that allowed me to see average times and ages across the fields for each year. I included a heat map to highlight the age of the winner for each year as well as a spotlight on times for the selected event. In addition, I created an at-a-glance podium for medal winners scrollable for athlete name, final time, and country the athlete is representing.
This tool allowed me to quickly visualize trends for each event and zoom in on those that were and were not impacted by the buoyant suit era. I could then see if it was an impact on the average of the top 8, or more specific to the winning time.
The dashboard also allowed me to get a quick glance at the ages of the winners each year and compare that to the average age of the field.
The interactive dashboard can be accessed on my Tableau Public page here
RESULTS
-
I expected to see progressively faster results in each event each year, and as a general trend this is the case.
-
I expected to see that athletes ages, on average, increased slightly over the years. In fact, I found a slight dip in average ages to 18-19 years of age in the late 1960’s to early 1980’s, with ages returning back to the low 20’s gradually. Swimmers closer to the upper 30’s and early 40’s were much less common.
-
I expected that the impact of the buoyant suit era might still be present, with the fastest times in some events still not yet meeting the fastest times from 2008. The Olympic debut in 2008 of the buoyant tech-suit resulted in many large time drops and record Olympic times. 2008 was the only olympic games to feature these suits that were subsequently banned in olympic swimming in 2010. In some cases we don’t see times dip below those seen in 2008 until 2020 (both slowest and fastest times). While a handful of events are still trending down toward the fastest times yet, many have seen results where the fastest times are now below those achieved during the buoyant suit era. It is noted that average times across the top 8 continue to trend downward (faster).
-
I expected any impact on time from the buoyant suit era would be represented equally across all events and seen in both men’s and women’s events. Indeed, both Men’s and Women’s swimming were impacted, but the impact on each event varies and is not a 1:1 relationship.
CONCLUSION
Never say “never” when it comes to athletics.
Regarding the change in average age over time, I am interested in what specific contributing factors may be at play. Are different training strategies selecting for ages such as the understanding of training and weight lifting principles? Are there other factors at play such as historical world or financial events that might impact the ability to train and participate in sport?
Regarding speed, along with the impact of training strategies, are athletes beliefs around what is possible having a significant impact on performance? How is access to professional competition and increased high level competition frequency for swimming changing the sport? Are athletes better in tune with more optimal nutrition and recovery principles?
In depth analysis is indicated to stay on top of the impacts of trends in training on performance and longevity in the sport. The findings of this analysis will likely have broad sweeping impact on all levels of the sport of swimming.